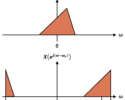
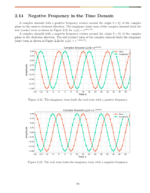
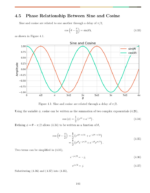

A strange effect happens when  as larger frequencies appears as smaller frequencies. Compare
  against
  in Figure 1. Both sinusoids appear to have the same frequency of
  but are 180 degrees out of phase. The larger frequency sinusoid can be represented with a negative frequency
  ,
,
(2) 
Similarly  looks to have the same frequency as
  ,
,  , and they are also 180 degrees out of phase. The larger frequency sinusoid can be represented with a negative frequency
  ,
,
(3) 
Finally, and maybe weirdest of all,  for all n.
If you’ve seen this effect before you’ll know it’s due to aliasing as a result of the Nyquist sampling theorem. Before jumping into that let’s take a look at aliasing in the context of the unit circle.
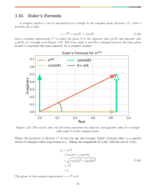
Where Figure 1 only plotted the imaginary portion of a complex sinusoid in the time domain as in (1),
(4) 
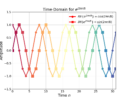
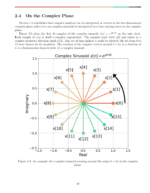
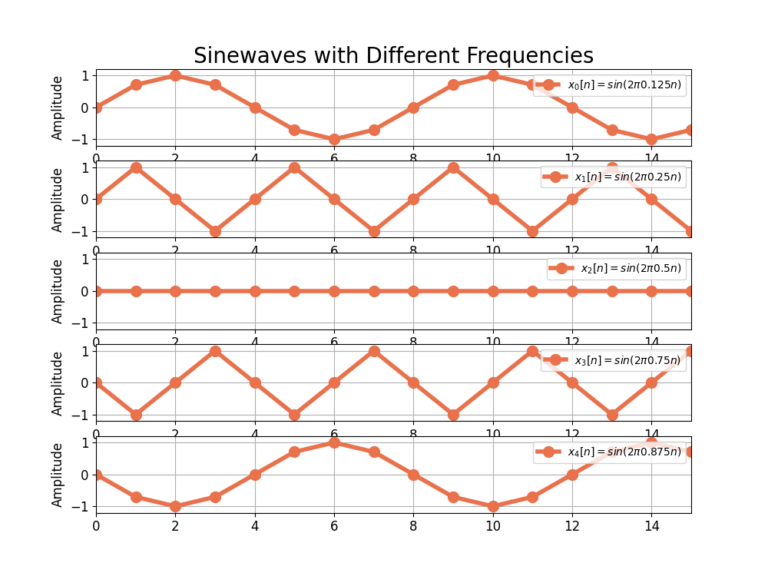
Figure 2 to Figure 6 display both the real and imaginary parts of the complex sinusoid on the unit circle where the complex sinusoids are given by
(5) ![\begin{equation*}\begin{split}x_{0}[n] & = e^{j2\pi 0.125 n}, \\x_{1}[n] & = e^{j2\pi 0.25 n}, \\x_{2}[n] & = e^{j2\pi 0.5 n}, \\x_{3}[n] & = e^{j2\pi 0.75 n}, \\x_{4}[n] & = e^{j2\pi 0.875 n}. \\\end{split}\end{equation*}](https://www.wavewalkerdsp.com/wp-content/ql-cache/quicklatex.com-8cf9eb3e6c6f7da2669974df1cb30c82_l3.png "Rendered by QuickLaTeX.com")
Figure 2 shows the complex sinusoid ![x_{0}[n] = e^{j2\pi 0.125n}](https://www.wavewalkerdsp.com/wp-content/ql-cache/quicklatex.com-15b8fd8a61776fa702b732d759bf7d19_l3.png "Rendered by QuickLaTeX.com") for n=0 to n=7. The angle of the complex sinusoid
for n=0 to n=7. The angle of the complex sinusoid ![\sphericalangle{x_{0}[n]}](https://www.wavewalkerdsp.com/wp-content/ql-cache/quicklatex.com-ce031fff80a1fe06611b041c864f9924_l3.png "Rendered by QuickLaTeX.com") is plotted in red and shows the instantaneous phase on
is plotted in red and shows the instantaneous phase on ![[-\pi, \pi]](https://www.wavewalkerdsp.com/wp-content/ql-cache/quicklatex.com-92a990c704d7a8c7514a323d99652e8f_l3.png "Rendered by QuickLaTeX.com") . The angle shows a perceived rotation in the counter-clockwise direction which is a positive frequency. The complex sinusoid takes 8 samples to go one full rotation around the unit circle therefore the perceived frequency is
. The angle shows a perceived rotation in the counter-clockwise direction which is a positive frequency. The complex sinusoid takes 8 samples to go one full rotation around the unit circle therefore the perceived frequency is  .
.
![Figure 2: The complex sinusoid x0[n] = e(j2 pi 0.125 n) plotted in the complex plane.](https://www.wavewalkerdsp.com/wp-content/uploads/2021/10/aliasingSamplingCarTires_sinusoidsUnitCircleGrid0.png)
Figure 3 shows the complex sinusoid ![x_{1}[n] = e^{j2\pi 0.25n}](https://www.wavewalkerdsp.com/wp-content/ql-cache/quicklatex.com-8fc6bab2b484a14a71cd699c5a6d812b_l3.png "Rendered by QuickLaTeX.com") for n=0 to n=7. The angle shows a positive frequency the complex vector appears to be rotating in the counter-clockwise direction. The complex sinusoid takes 4 samples to go one full rotation around the unit circle therefore the perceived frequency is
for n=0 to n=7. The angle shows a positive frequency the complex vector appears to be rotating in the counter-clockwise direction. The complex sinusoid takes 4 samples to go one full rotation around the unit circle therefore the perceived frequency is  .
.
![Figure 3: The complex sinusoid x1[n] = e(j2 pi 0.25 n) plotted in the complex plane.](https://www.wavewalkerdsp.com/wp-content/uploads/2021/10/aliasingSamplingCarTires_sinusoidsUnitCircleGrid1.png)
Figure 4 shows the complex sinusoid ![x_{2}[n] = e^{j2\pi 0.5n}](https://www.wavewalkerdsp.com/wp-content/ql-cache/quicklatex.com-8ab043107ee870964423cd1774a55a72_l3.png "Rendered by QuickLaTeX.com") for n=0 to n=7. The angle is a special case in that it alternates between 0 and
for n=0 to n=7. The angle is a special case in that it alternates between 0 and  which can be considered rotation in the clockwise direction or counter-clockwise direction. The complex sinusoid takes 2 samples to go one full rotation around the unit circle therefore the perceived frequency is
  .
.
![Figure 4: The complex sinusoid x2[n] = e(j2 pi 0.5 n) plotted in the complex plane.](https://www.wavewalkerdsp.com/wp-content/uploads/2021/11/aliasingSamplingCarTires_sinusoidsUnitCircleGrid2.png)
Figure 5 shows the complex sinusoid ![x_{3}[n] = e^{j2\pi 0.75n}](https://www.wavewalkerdsp.com/wp-content/ql-cache/quicklatex.com-3b9d95f4a2c43f67dde7655194338018_l3.png "Rendered by QuickLaTeX.com") for n=0 to n=7. The angle is rotating in a clockwise direction and the complex sinusoid takes 4 samples to go one full rotation around the unit circle therefore the perceived frequency is
for n=0 to n=7. The angle is rotating in a clockwise direction and the complex sinusoid takes 4 samples to go one full rotation around the unit circle therefore the perceived frequency is  although in reality it is
  . The aliased frequency can be represented by
  radians which is the perceived frequency seen in Figure 5. The complex vector appearing to rotate in the opposite direction is the exact same effect as the car tire rotating in the opposite direction as in the YouTube video above.
![Figure 5: The complex sinusoid x3[n] = e(j2 pi 0.75 n) plotted in the complex plane.](https://www.wavewalkerdsp.com/wp-content/uploads/2021/10/aliasingSamplingCarTires_sinusoidsUnitCircleGrid3.png)
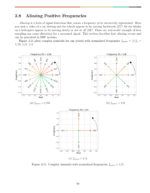
Figure 6 shows the complex sinusoid ![x_{4}[n] = e^{j2\pi 0.875n}](https://www.wavewalkerdsp.com/wp-content/ql-cache/quicklatex.com-5cb1eb01748fea7f8eef85bfe444fcb5_l3.png "Rendered by QuickLaTeX.com") for n=0 to n=7. The angle is rotating in a clockwise direction and the complex sinusoid takes 8 samples to go one full rotation around the unit circle therefore the perceived frequency is
for n=0 to n=7. The angle is rotating in a clockwise direction and the complex sinusoid takes 8 samples to go one full rotation around the unit circle therefore the perceived frequency is  although in reality it is
  . The aliased frequency can be represented by
  radians which is the perceived frequency seen in Figure 6. The complex vector seemingly rotating in a clockwise direction rather than the counter-clockwise direction is the exact same effect as the car tire appearing to rotate in the reverse direction as in the YouTube video above.
![Figure 6: The complex sinusoid x4[n] = e(j2 pi 0.875 n) plotted in the complex plane.](https://www.wavewalkerdsp.com/wp-content/uploads/2021/10/aliasingSamplingCarTires_sinusoidsUnitCircleGrid4.png)
When  the actual frequency matches the perceived frequency, as in Figure 2 and Figure 3, and the complex sinusoid rotates around the unit circle in a counter-clockwise direction. Figure 4 shows an interesting phenomenon: the direction of the rotation around the unit circle cannot be stated to be either clockwise or counter-clockwise when
  . When
(6) 
the perceived frequency appears to be negative  and the complex vector is rotating in a clockwise direction.
The Nyquist sampling theorem states that a signal can be perfectly reconstructed if it is sampled with frequency  which is greater than or equal to twice the largest frequency
  in the signal [Proakis2007, p.13]
(7) 
Another way to state the Nuyquist sampling theorem is that no aliasing distortion will occur if the ratio of the largest frequency in the signal to sampling frequency is less than or equal to 1/2,
(8) 
Note that the ratio in (8) is the boundary upon which aliasing occurs which can be seen in Figure 1 through Figure 6. When  the actual frequency and perceived frequency are the same, however when
  the frequency is aliased or “folded” to frequency
  [Lyons2011, p.40].
Aliasing is a form of distortion and occurs when the Nyquist sampling rate  is not satisfied. Aliasing causes actual frequencies
  to be folded into negative frequencies causing distortion of the underlying signal. Maintaining the proper ratio of sample rate to signal bandwidth in each operation in your DSP system will avoid aliasing.
More blog posts on complex sinusoids: