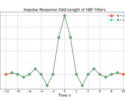
![Figure 1: The weights of the partitioned half band filter hA[n] and hB[n].](https://www.wavewalkerdsp.com/wp-content/uploads/wordpress-popular-posts/2226-featured-125x100.png)
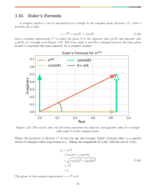
Figure 1 plots the exponential numbers  ,
,  , and
, and  . The base number determines how quickly the exponential number grows. The larger the base number the faster the growth.
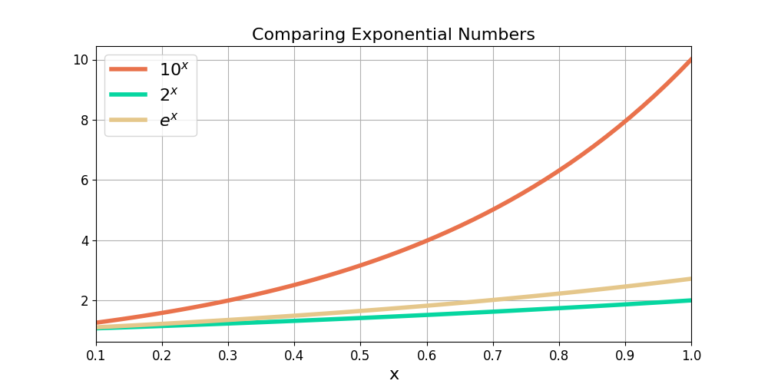
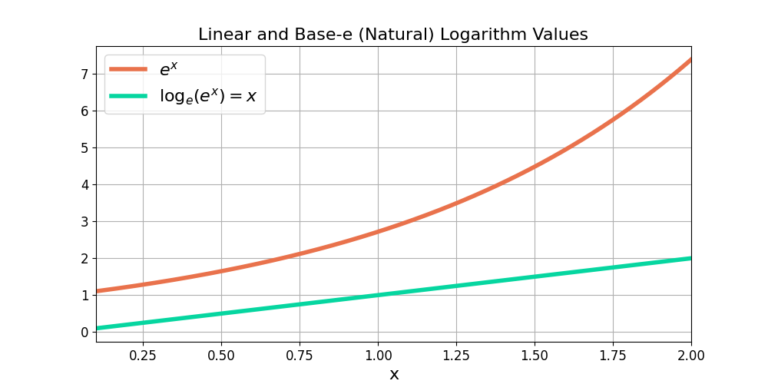
Figure 2 shows the linear plot of x versus . In this plot the number appears exponential on the y-axis for increases in x. The base-10 logarithm returns the exponent of , which is x, which appears linearly on the plot.
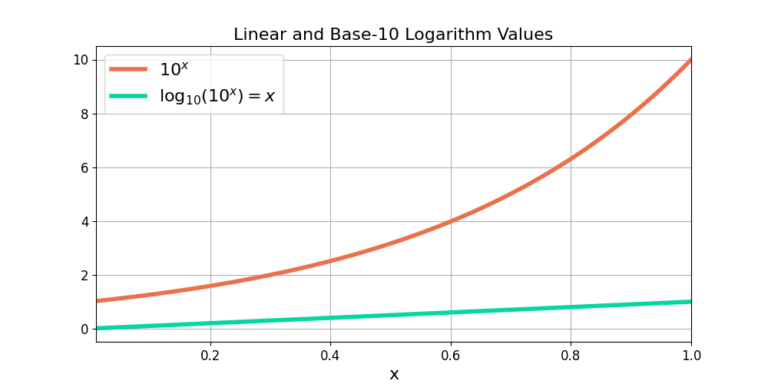
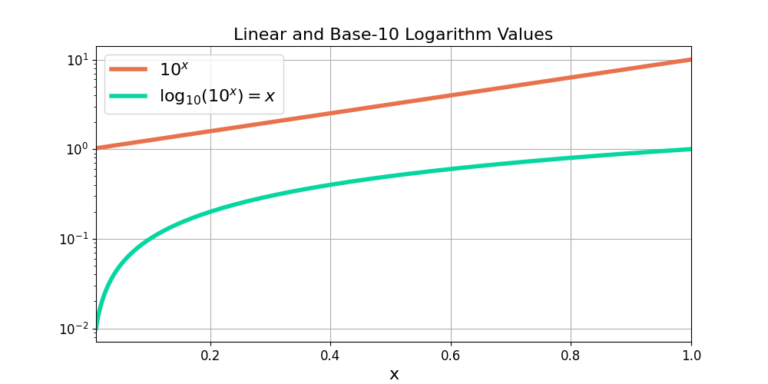
Figure 3 is a logarithmic plot on the y-axis, referred to as a semilog plot. The logarithmic plot converts the numbers using log10() before plotting them. Therefore the y-axis shows the exponential as linear,
(1) 
and the number x as logarithmic,
(2) 
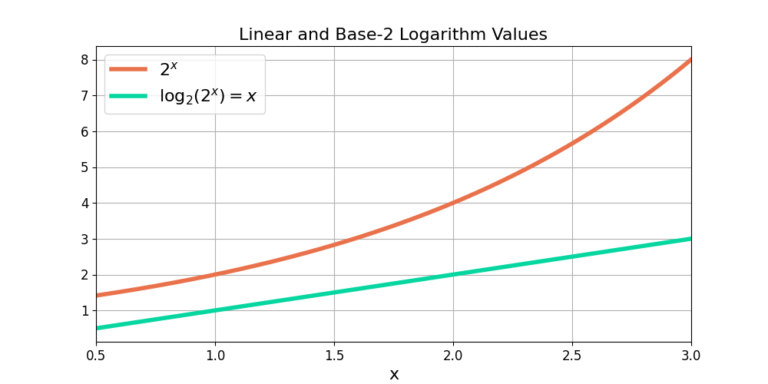
A linear plot will show an exponential number, say , as exponential and a linear number x as linear. However a logarithmic plot, or semilog plot, will show an exponential number as linear and a linear number as logarithmic.
Khan Academy also has a great video on explaining logarithms you can check out here.
Check out these other blogs on DSP math: