![A BPSK signal s[n], real Gaussian noise w[n], and the received signal x[n] = s[n] + w[n] for SNR = 20 dB](https://www.wavewalkerdsp.com/wp-content/uploads/wordpress-popular-posts/15621-featured-125x100.png)
![Figure 1: The two sequences for the autocorrelation of x0[n] and x0[n].](https://www.wavewalkerdsp.com/wp-content/uploads/wordpress-popular-posts/5515-featured-125x100.png)
Cross correlation is a mathematical measure of similarity between two signals. The time lag  is used to measure the similarity between two signals as they are shifted in time relative to one another by samples. In this blog post examples will be given which explain why time lags are used in the cross correlation equation.
More posts in the cross correlation series:
The blog post Cross Correlation Explained With Real Signals described how cross correlation compares the similarity of two signals. The examples used signals which:
- are the same length,
- and have no relative time delay.
Under these conditions the cross correlation can be simplified to
(1) ![\begin{equation*}R_{xy}[0] = \sum_{n} x[n] y^*[n].\end{equation*}](https://www.wavewalkerdsp.com/wp-content/ql-cache/quicklatex.com-c9c18fcd05b7cff91c1dfdfd165d6de6_l3.png "Rendered by QuickLaTeX.com")
However when the sequences x[n] and y[n] are of unequal length the time lag is needed to time align them and measure their similarity at multiple time delays.
The cross correlation for discrete-time sequences is defined as
(2) ![\begin{equation*}R_{xy}[\tau] = \sum_{n} x[n] y^*[n-\tau].\end{equation*}](https://www.wavewalkerdsp.com/wp-content/ql-cache/quicklatex.com-59e5e5cec903edec1cd7c29587b803ed_l3.png "Rendered by QuickLaTeX.com")
The time lag is used to apply a relative time shift the two sequences so their similarity can be compared over time. The following section demonstrates an example on calculating cross correlation over multiple values of .
The sequence x[n] is defined according to
(3) ![\begin{equation*}x[n] =\begin{cases}1, & n = 0 \\1, & n = 1 \\-1, & n = 2 \\-1, & n = 3 \\1, & n = 4 \\0, & \text{otherwise}\end{cases}\end{equation*}](https://www.wavewalkerdsp.com/wp-content/ql-cache/quicklatex.com-670384b0fa89aa79c53f00922f280285_l3.png "Rendered by QuickLaTeX.com")
which has length of 5 samples. Now consider a signal y[n] which has a length of 4 samples,
(4) ![\begin{equation*}y[n] =\begin{cases}1, & n = 0 \\1, & n = 1 \\1, & n = 2 \\1, & n = 3 \\0, & \text{otherwise.}\end{cases}\end{equation*}](https://www.wavewalkerdsp.com/wp-content/ql-cache/quicklatex.com-fa07b6a791bf79d8785b04467b80a219_l3.png "Rendered by QuickLaTeX.com")
The sequences x[n] and y[n] are plotted in the time domain in Figure 1.
![Figure 1: The sequences x[n] and y[n] in the time domain.](https://www.wavewalkerdsp.com/wp-content/uploads/2021/12/CrossCorrelationExplainingTimeLags_timeDomain_xy-1-768x480.png)
How can the similarity be compared between x[n], which 4 samples long, and y[n], which is 5 samples long? Since x[n] is shorter than y[n] the first step would be to compare the first 4 samples of x[n] with y[n]. The cross correlation between x[n] and y[n] with no relative time delay ( ) is
) is
(5) ![\begin{equation*}\begin{split}R_{xy}[0] & = \sum_{n} x[n] y^*[n] \\& = \sum_{n=0}^{4} x[n] y^*[n] \\& = x[0]y^*[0] + x[1]y^*[1] + x[2]y^*[2] + x[3]y^*[3] + x[4]y^*[4] \\& = (1\cdot 1) + (1\cdot 1) + (1\cdot -1) + (-1\cdot -1) + (0\cdot 1) \\& = 2.\end{split}\end{equation*}](https://www.wavewalkerdsp.com/wp-content/ql-cache/quicklatex.com-6d59ba37aac5c604f356763e99eb0df1_l3.png "Rendered by QuickLaTeX.com")
The second step to compare the signals would be to compare the last 4 samples of x[n] with y[n], or equivalently compare x[n] with y[n-1]. The sequences x[n] and y[n-1] are shown in Figure 2.
![Figure 2: The time domain sequences for x[n] and y[n-1].](https://www.wavewalkerdsp.com/wp-content/uploads/2021/12/CrossCorrelationExplainingTimeLags_timeDomain_xy1-768x480.png)
The cross correlation between x[n] and y[n] with a  sample relative delay is the same as delaying y[n] by 1 sample, y[n-1], and then multiplying it against x[n] and summing the result. The cross correlation at is calculated by
(6) ![\begin{equation*}\begin{split}R_{xy}[1] & = \sum_{n} x[n] y^*[n-1] \\& = \sum_{n=0}^{5} x[n] y^*[n-1] \\& = x[0]y^*[-1] + x[1]y^*[0] + x[2]y^*[1] + x[3]y^*[2] + x[4]y^*[3] \\& = (1\cdot 0) + (1\cdot 1) + (-1\cdot 1) + (-1\cdot 1) + (1\cdot -1) \\& = -2.\end{split}\end{equation*}](https://www.wavewalkerdsp.com/wp-content/ql-cache/quicklatex.com-d1fac0075bcdab053464986ea3df4601_l3.png "Rendered by QuickLaTeX.com")
Question: Does (5) or (6) better represent the cross-correlation between x[n] and y[n]? Which demonstrates the similarity of the two sequences better?
Answer: Both (5) and (6) represent a portion of the cross-correlation between x[n] and y[n]. Neither of the two cross-correlation values is more important or carries more information, they are measuring the similarity at different time delays.
While this example only compared the sequences for two values of , cross correlation is used over much longer sequences and more values of to fully characterize the similarity between two sequences. One way this characterization is applied is by searching for a known sequence.
Cross correlation can be used to locate a known sequence c[n] within a longer sequence y[n]. The cross correlation is defined by
(7) ![\begin{equation*}R_{yc}[\tau] = \sum_{n} y[n] c^*[n-\tau].\end{equation*}](https://www.wavewalkerdsp.com/wp-content/ql-cache/quicklatex.com-761697cfc383ff3b0deb95b611230498_l3.png "Rendered by QuickLaTeX.com")
The cross correlation (7) slides the sequence c[n] through y[n] through multiple time delays ![c[n-\tau]](https://www.wavewalkerdsp.com/wp-content/ql-cache/quicklatex.com-99effb93877f1c976b100840a0f1f16e_l3.png "Rendered by QuickLaTeX.com") .
.
Comparing the similarity between the two sequences at multiple time lags is a gauge as to the most likely location of the known sequence. The time lag T is defined when the location of the known sequence when ![|R_{yc}[\tau]|](https://www.wavewalkerdsp.com/wp-content/ql-cache/quicklatex.com-14082dd670c3f3dc54ea43fce32314ff_l3.png "Rendered by QuickLaTeX.com") is the maximum value. Mathematically this is stated by:
is the maximum value. Mathematically this is stated by:
(8) ![\begin{equation*}T = \arg \max_{\tau} |R_{yc}[\tau]|\end{equation*}](https://www.wavewalkerdsp.com/wp-content/ql-cache/quicklatex.com-e651cb3f0b9a6b1ca87d5d51f8561d70_l3.png "Rendered by QuickLaTeX.com")
where T is the starting sample of the sequence c[n] within y[n].
The following example shows how to use cross correlation to find a known sequence, a Barker code, in the middle of a series of random and noisy symbols.
The length 13 Barker code is defined as
(9) ![\begin{equation*}c[n] = \begin{cases}1, & n = 0 \\1, & n = 1\\1, & n = 2\\1, & n = 3\\1, & n = 4\\-1, & n = 5\\-1, & n = 6\\1, & n = 7\\1, & n = 8\\-1, & n = 9\\1, & n = 10\\-1, & n = 11\\1, & n = 12\\\end{cases}.\end{equation*}](https://www.wavewalkerdsp.com/wp-content/ql-cache/quicklatex.com-57d5f1a71664ce8d2133ac1d7c58fa5d_l3.png "Rendered by QuickLaTeX.com")
The longer sequence y[n] is a series of 32 random samples from +1 and -1, followed by the same Barker code, followed by 32 more random +1 and -1 samples, with white Gaussian noise added to all of the samples. The Barker code c[n] is plotted in Figure 3 and the noisy sequence y[n] is plotted in Figure 4.
![Figure 3: The length 13 Barker code sequence c[n].](https://www.wavewalkerdsp.com/wp-content/uploads/2021/12/CrossCorrelationExplainingTimeLags_barkerCode-768x480.png)
![Figure 4: The noisy sequence y[n] is 32 random samples of +1 and -1, followed by the Barker code c[n], followed by another 32 random samples of +1 and -1, all with additive white Gaussian noise (AWGN).](https://www.wavewalkerdsp.com/wp-content/uploads/2021/12/CrossCorrelationExplainingTimeLags_receiveSymbols-768x480.png)
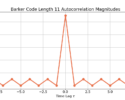
The cross correlation ![R_{yc}[\tau]](https://www.wavewalkerdsp.com/wp-content/ql-cache/quicklatex.com-b0b0dcc9cc57ce2bdef238d2adaa4fea_l3.png "Rendered by QuickLaTeX.com") is plotted in Figure 5. The cross correlation has both positive and negative values which just indicate the polarity of the similarity between the two sequences (see previous post). However, the magnitude of the cross correlation removes the positive or negative sign and the maximum value of the cross correlation can be found from
is plotted in Figure 5. The cross correlation has both positive and negative values which just indicate the polarity of the similarity between the two sequences (see previous post). However, the magnitude of the cross correlation removes the positive or negative sign and the maximum value of the cross correlation can be found from ![|R_{yc}[\tau]](https://www.wavewalkerdsp.com/wp-content/ql-cache/quicklatex.com-a43ea30e26031471e9e748c11f6b18ee_l3.png "Rendered by QuickLaTeX.com") , plotted in Figure 6.
, plotted in Figure 6.
![Figure 5: The cross correlation between c[n] and y[n], Ryc[tau].](https://www.wavewalkerdsp.com/wp-content/uploads/2021/12/CrossCorrelationExplainingTimeLags_barkerCrossCorrNoisy-768x480.png)
![Figure 6: The magnitude of the cross correlation between c[n] and y[n], |Ryc[tau]|.](https://www.wavewalkerdsp.com/wp-content/uploads/2021/12/CrossCorrelationExplainingTimeLags_barkerCrossCorrAbsNoisy-768x480.png)
The location of the maximum sample can be found in Python with NumPy’s argmax() function:
import numpy as np
Ryc = np.correlate(y,c,mode='full')
T = np.argmax(Ryc)
where T = 44. The time index be validated by knowing the length of the correlating sequence c[n] (13 samples) and the time offset of c[n] into y[n] (32 samples), such that
(10) 
where the -1 is needed for zero-based indexing.
Cross correlation is calculated over multiple time lags because it provides information about the similarity of two sequences as they are delayed in time with one another. Cross correlation can also be used to find a known sequence within a longer noisy sequence by finding the time index T of the maximum of the absolute value of the cross correlation .
More posts in the cross correlation series: