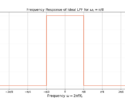
Correlation for DSP engineers, referred to as cross-correlation, is slightly different than the equation used by statisticians and mathematicians but they share the same underlying principles. The cross-correlation of sequences x[n] and y[n] is given by [gardner1988, p.212]
(1) ![\begin{equation*}R_{xy}[\tau] = \sum_{n} x[n] y^*[n-\tau].\end{equation*}](https://www.wavewalkerdsp.com/wp-content/ql-cache/quicklatex.com-82383f13a4dcdbc23da5d20de800beef_l3.png "Rendered by QuickLaTeX.com")
The term  is referred to as the “time-lag” and controls the relative time delay between the two sequences. The cross-correlation (1) at
  calculates the similarity when there is no relative time delay,
(2) ![\begin{equation*}R_{xy}[0] = \sum_{n} x[n] y^*[n].\end{equation*}](https://www.wavewalkerdsp.com/wp-content/ql-cache/quicklatex.com-87e6abb4f81016c89560c94c1daa9778_l3.png "Rendered by QuickLaTeX.com")
A special case of the cross-correlation is when x[n] = y[n] is referred to as autocorrelation,
(3) ![\begin{equation*}R_{x}[\tau] = \sum_{n} x[n] x^*[n-\tau].\end{equation*}](https://www.wavewalkerdsp.com/wp-content/ql-cache/quicklatex.com-b19fabecfed5c88d3c438efd4cc0571e_l3.png "Rendered by QuickLaTeX.com")
A large correlation value means the sequences x[n] and y[n] are similar while a large negative correlation means the sequences are similar but have opposite polarity. Small correlation values means the sequences have weak similarity while a correlation of 0 means the sequences have no similarity.
Consider a sequence
(4) ![\begin{equation*}x_{0}[n] = \begin{cases}1, & n = 0 \\-1, & n = 1 \\1, & n = 2 \\-1, & n = 3 \\0, & \text{otherwise.}\end{cases}\end{equation*}](https://www.wavewalkerdsp.com/wp-content/ql-cache/quicklatex.com-584a55dee00b2c5e4e67102382061773_l3.png "Rendered by QuickLaTeX.com")
The sequence ![x_{0}[n]](https://www.wavewalkerdsp.com/wp-content/ql-cache/quicklatex.com-e1ddb70a77d6622b1f2fbdd968c0555d_l3.png "Rendered by QuickLaTeX.com") autocorrelates at (2) according to
autocorrelates at (2) according to
(5) ![\begin{equation*}\begin{split}R_{x_{0}}[0] & = \sum_{n} x_{0}[n] x_{0}^*[n] \\& = \left( 1 \cdot 1 ) + (-1 \cdot -1) + (1 \cdot 1 ) + (-1 \cdot -1) \\& = 4.\end{split}\end{equation*}](https://www.wavewalkerdsp.com/wp-content/ql-cache/quicklatex.com-2b0301d0553adcfa45833e7b05a836e4_l3.png "Rendered by QuickLaTeX.com")
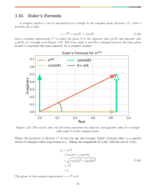
Figure 1 shows that the two sequences are identical at  (no relative time delay) and therefore they should have the maximum correlation value, which in this case is 4. The larger the correlation, the larger the similarity.
![Figure 1: The two sequences for the autocorrelation of x0[n] and x0[n].](https://www.wavewalkerdsp.com/wp-content/uploads/2021/11/correlationExplained_timeDomain_x0x0-768x480.png)
Consider a sequence which is the negative of ,
(6) ![\begin{equation*}x_{1}[n] = -x_{0}[n]\end{equation*}](https://www.wavewalkerdsp.com/wp-content/ql-cache/quicklatex.com-123efa7308ded3d8969501de23af2a4a_l3.png "Rendered by QuickLaTeX.com")
such that
(7) ![\begin{equation*}x_{1}[n] = \begin{cases}-1, & n = 0 \\1, & n = 1 \\-1, & n = 2 \\1, & n = 3 \\0, & \text{otherwise.}\end{cases}\end{equation*}](https://www.wavewalkerdsp.com/wp-content/ql-cache/quicklatex.com-4794a71ae6bf588f31d746863771260c_l3.png "Rendered by QuickLaTeX.com")
The cross-correlation between and ![x_{1}[n]](https://www.wavewalkerdsp.com/wp-content/ql-cache/quicklatex.com-e1a1b1431d34a10e5d1d8f217a150e85_l3.png "Rendered by QuickLaTeX.com") at from (2) is
at from (2) is
(8) ![\begin{equation*}\begin{split}R_{x_{0}x_{1}}[0] & = \sum_{n} x_{0}[n] x_{1}^*[n] \\& = \left( 1 \cdot -1 ) + (-1 \cdot 1) + (1 \cdot -1 ) + (-1 \cdot 1) \\& = -4.\end{split}\end{equation*}](https://www.wavewalkerdsp.com/wp-content/ql-cache/quicklatex.com-1298d1c3c103708618263e52026c79b7_l3.png "Rendered by QuickLaTeX.com")
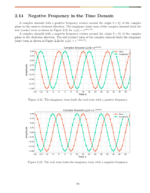
A negative correlation value means that the two sequences are similar at (no relative time delay) but have opposite polarity. Figure 2 shows that the two sequences are the same with opposite polarity which is why the cross-correlation in (8) is the maximum negative value, -4.
![Figure 2: The two sequences for the cross correlation of x0[n] and x1[n].](https://www.wavewalkerdsp.com/wp-content/uploads/2021/11/correlationExplained_timeDomain_x0x1-768x480.png)
Consider a sequence ![x_{2}[n]](https://www.wavewalkerdsp.com/wp-content/ql-cache/quicklatex.com-198cab7859a4929620159d5ac7907337_l3.png "Rendered by QuickLaTeX.com") which has 1 data point in difference from such that
which has 1 data point in difference from such that
(9) ![\begin{equation*}x_{2}[n] =\begin{cases}-1, & n = 0 \\-1, & n = 1 \\1, & n = 2 \\-1, & n = 3 \\0, & \text{otherwise.}\end{cases}\end{equation*}](https://www.wavewalkerdsp.com/wp-content/ql-cache/quicklatex.com-000627cf55c5c953d1bd69c65a8861c5_l3.png "Rendered by QuickLaTeX.com")
The cross-correlation between and at from (2) is
(10) ![\begin{equation*}\begin{split}R_{x_{0}x_{2}}[0] & = \sum_{n} x_{0}[n] x_{2}^*[n] \\& = \left( 1 \cdot -1 ) + (-1 \cdot -1) + (1 \cdot 1 ) + (-1 \cdot -1) \\& = 2.\end{split}\end{equation*}](https://www.wavewalkerdsp.com/wp-content/ql-cache/quicklatex.com-0ca65641a57cc2392f1bccbd4170cae4_l3.png "Rendered by QuickLaTeX.com")
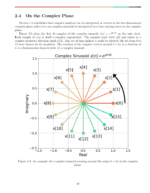
A weak correlation value of 2 in (10) as compared to 4 in (5) means that the two sequences share some similarity at but are not the exact same. Figure 3 shows that the two sequences are similar but with a single difference at n=0 which is why the cross-correlation in (10) is only 2.
![Figure 3: The two sequences for the cross correlation of x0[n] and x2[n].](https://www.wavewalkerdsp.com/wp-content/uploads/2021/11/correlationExplained_timeDomain_x0x2-768x480.png)
Consider a sequence ![x_{3}[n]](https://www.wavewalkerdsp.com/wp-content/ql-cache/quicklatex.com-35fc477dcc176f210151d5dc5d437fed_l3.png "Rendered by QuickLaTeX.com") which has 1 data point the same as but the other 3 are opposite polarity such that
which has 1 data point the same as but the other 3 are opposite polarity such that
(11) ![\begin{equation*}x_{3}[n] =\begin{cases}-1, & n = 0 \\1, & n = 1 \\-1, & n = 2 \\-1, & n = 3 \\0, & \text{otherwise.}\end{cases}\end{equation*}](https://www.wavewalkerdsp.com/wp-content/ql-cache/quicklatex.com-ba57c9bab8ae1db97a1ad24b04c14a46_l3.png "Rendered by QuickLaTeX.com")
The cross-correlation between and at from (2) is
(12) ![\begin{equation*}\begin{split}R_{x_{0}x_{3}}[0] & = \sum_{n} x_{0}[n] x_{3}^*[n] \\& = \left( 1 \cdot -1 ) + (-1 \cdot 1) + (1 \cdot -1 ) + (-1 \cdot -1) \\& = -2.\end{split}\end{equation*}](https://www.wavewalkerdsp.com/wp-content/ql-cache/quicklatex.com-75c7b793f9b62e28f79eaee67fc5be44_l3.png "Rendered by QuickLaTeX.com")
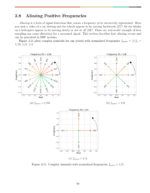
A weak negative correlation value of -2 means that the two sequences share some similarity at with opposite polarity but are not the exact same. Figure 4 shows that the two sequences are similar but with a single sample at n=3 in common, while the other three samples at n=0, 1, 2 are the opposite polarity which is why the cross-correlation in (12) is only -2.
![Figure 4: The two sequences for the cross correlation of x0[n] and x3[n].](https://www.wavewalkerdsp.com/wp-content/uploads/2021/11/correlationExplained_timeDomain_x0x3-768x480.png)
Correlation is a way to mathematically measure similarity of two sequences. A large positive correlation means the two sequences are similar whereas a large negative correlation means the two sequences are similar but have opposite polarity. A small correlation value, positive or negative, means the two sequences share few similarities. A correlation value of zero means the two sequences do not share any similarities.
This post covered a subset of the cross-correlation, only for , in order to simplify the examples in this introduction. A future blog post will describe why the cross-correlation is computed over all time lags and how cross-correlation is applied in DSP algorithms.
You might enjoy these other posts:
- Fourier Transform Explanation as a Cross-Correlation
- Cross Correlation: Explaining Time Lags
- Half Band Filter Design: Exceptional Filtering Efficiency!
I hope you enjoyed this post explaining correlation, please check out others in the DSP Math series!